

Adani Ports Technical Analysis: Trend, Support & Resistance
Report Date: 13 October 2026
NSE Symbol: ADANIPORTS | BSE Code: 532921
Sector: Infrastructure – Ports, Logistics & Marine Services
Recommendation: Neutral Editorial Assessment – No Buy / Sell Recommendation
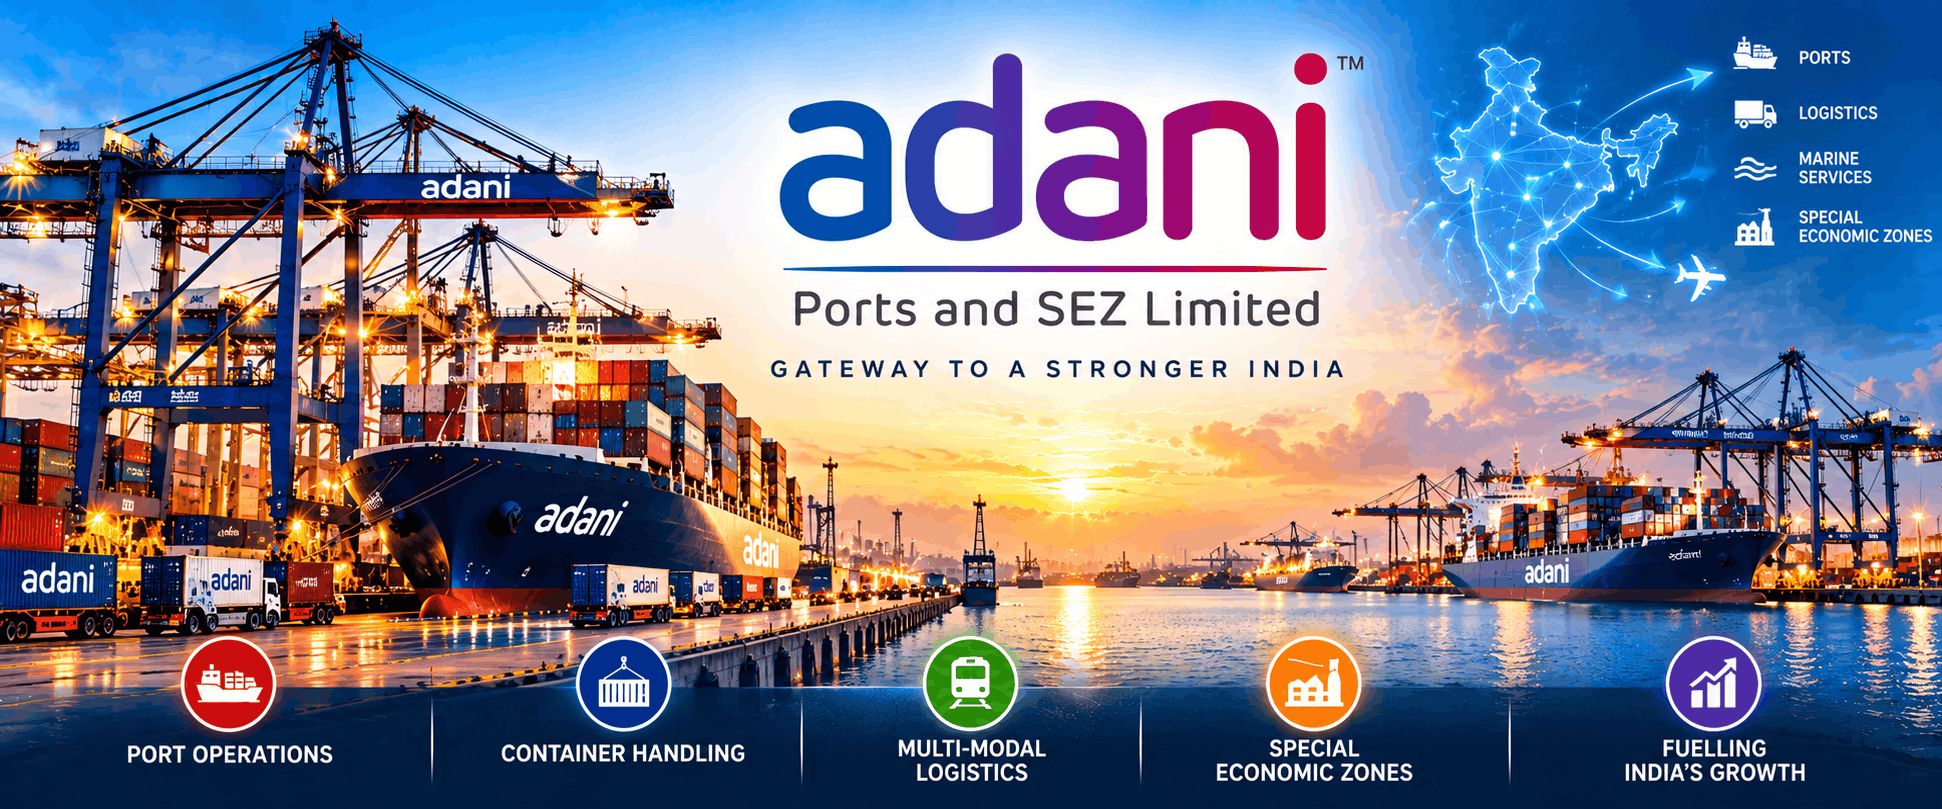
Adani Ports and Special Economic Zone Limited (APSEZ) is India's largest integrated transport operator, with businesses spanning domestic and international ports, logistics, marine services and special economic zones.
Its operations support international trade, industrial activity, container transportation and India's expanding logistics infrastructure. Business performance depends on cargo volumes, port utilisation, operating margins and global trade conditions.
Latest Financial Performance
For Q1 FY2026–27, ended June 2026, Adani Ports reported consolidated revenue of ₹10,821 crore, representing 19% year-on-year growth. Consolidated EBITDA increased 19% to ₹6,541 crore, while profit after tax rose 10% to ₹3,650 crore. Domestic cargo volumes reached 115.3 million metric tonnes. International ports revenue increased 80%, reflecting business expansion and contributions from overseas operations.
The company's net debt-to-EBITDA ratio stood at approximately 1.9 times. These results indicate operational growth, although future performance remains dependent on cargo demand, capital expenditure and international economic conditions.
Technical Analysis – Market Trend
On 12 October 2026, Adani Ports traded around ₹1755.
The technical structure indicated a broadly positive medium-term trend with short-term consolidation. The 14-day Relative Strength Index (RSI) stood near 50.94, indicating neutral momentum without significant overbought or oversold conditions. The stock traded below its 20-day simple moving average of approximately ₹ 1770 but remained above its 50-day moving average of ₹ 1721 and 200-day moving average of ₹ 1634.
This combination suggests short-term hesitation within a relatively stronger longer-term price structure.
Support and Resistance Levels :
Sustained movement above ₹ 1787, accompanied by improving trading volumes, could indicate strengthening momentum. Subsequent resistance levels are located near ₹ 1808.
Weakness below the ₹ 1760 may indicate deteriorating short-term sentiment. Further support is positioned near ₹ 1737 followed by ₹ 1720.
Neither scenario represents a prediction or trading recommendation.
Growth Opportunities
India's expanding international trade, industrial infrastructure and container transportation requirements provide potential long-term growth opportunities.
Adani Ports' capacity expansion, integrated logistics operations and international presence may support business diversification and operating efficiencies.
However, successful project execution and financial discipline remain essential.
Key Risk Factors
Major risks include global trade disruptions, geopolitical uncertainty, shipping-route disturbances, currency fluctuations and changing cargo demand.
Other considerations include infrastructure investment requirements, regulatory developments, debt servicing and competition from domestic and international port operators.
Investment Point Editorial Assessment
Adani Ports demonstrates improving financial performance and an expanding transport infrastructure business. Its medium-term technical structure remains relatively constructive, while near-term price movement suggests consolidation. Investors should independently examine valuations, financial disclosures, operating cash flows and market risks.
Overall Assessment: Neutral and Observation-Based. No target price or Buy, Sell or Hold recommendation is assigned.
This report is intended exclusively for educational and informational purposes. It does not constitute personalised investment advice or a securities recommendation. Technical levels are subject to change. Investments in securities markets are subject to market risks.
Disclaimer :
Investments in the securities market are subject to market risks. All content and Index / securities mentioned are strictly for educational and journalistic purposes and do not constitute personalized buy, sell, or hold investment recommendations, Please read all related documents and full disclosures at nikhilbhatt.in before investing.